APPLIED FIELDWORK
TYPES OF DATA
Two types of data are QUALITATIVE and QUANTITATIVE
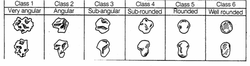
Qualitative is an opinion, for example the shape of a pebble
Quantitative means the actual facts and figures, such as the slope on a beach
Two types of data are QUALITATIVE and QUANTITATIVE
Qualitative is an opinion, for example the shape of a pebble
Quantitative means the actual facts and figures, such as the slope on a beach
TYPES OF DATA
Two types of data collection are PRIMARY and SECONDARY
Primary data is data that you collect yourself, such as a table of results from an experiment that you did.
Secondary data is data that is collected by someone other than the user, such as a map.
Two types of data collection are PRIMARY and SECONDARY
Primary data is data that you collect yourself, such as a table of results from an experiment that you did.
Secondary data is data that is collected by someone other than the user, such as a map.
|
OTHER TYPES OF DATA COLLECTION
Other types of data include RANDOM, STRATIFIED and SYSTEMATIC RANDOM data collection is to use a random number, for example to use a random number of metres between a data collection, measuring pebbles on a beach at random intervals. STRATIFIED data is data collection using categories, for example grouping sand dunes of different ages, and measuring the height of grass. SYSTEMATIC data is data collection in regular intervals, for example measuring the slope of a beach at 3 metre angles, and plotting a graph to show us the relation. You can do this by using a gun clinometer, and using two metre rulers at 3 metre intervals, using the gun clinometer to point upwards at the other ruler. |
|
TRANSECT
A transect is a line following a route upon which a survey or an observation is made.
A transect is a line following a route upon which a survey or an observation is made.
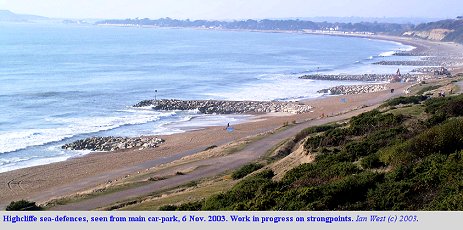 Rock Groynes at Highcliffe
Field Trip Null Hypothesis
Longshore drift goes from west to east.
Longshore drift goes from west to east.
My Field Trip
On my field trip to Highcliffe beach we drew a transect up the width of the beach with a 20 metre long tape measure. We then measured pebbles at 3 metre intervals from the sea using a calliper in cm. To do this we laid a quadrant and took a pebble from each corner of the quadrat. We also decided what shape they were using a chart(see below) to decide how angular/rounded the pebbles were. We then recorded this data, and measured the volume of the pebbles using a displacement method. We filled a jug up to 500cm cubed. We then added the pebble, and took the new value away from the original value, which gave us the volume of the pebble. After this, we measured the slope of the beach with a gun clinometer. This showed us the direction of longshore drift. We did this in locations close to the groyne and between the groynes. Our results were as followed:(graphs at top of page) group 1 was to the east of the beach, group 5 to the west of the beach, and the other groups between those two groups. There was no correlation in our results, as they all said different things. This could mean that the beach had mean managed recently, so long shore drift hadn't had time to properly move the sediment as much as it would have if the beach had not been managed. However, we did see that the further up the beach that you got, the higher the beach was. We saw that the beach was higher on the west than on the east, but in the middle there was no correlation. Group 1 was about 4 metres high, group 2 was about 6.5 metres high, group 3 was about 5.5 metres high, group 4 was 3 metres high, group 5 was about 9 metres high. This is clearly no correlation.
On my field trip to Highcliffe beach we drew a transect up the width of the beach with a 20 metre long tape measure. We then measured pebbles at 3 metre intervals from the sea using a calliper in cm. To do this we laid a quadrant and took a pebble from each corner of the quadrat. We also decided what shape they were using a chart(see below) to decide how angular/rounded the pebbles were. We then recorded this data, and measured the volume of the pebbles using a displacement method. We filled a jug up to 500cm cubed. We then added the pebble, and took the new value away from the original value, which gave us the volume of the pebble. After this, we measured the slope of the beach with a gun clinometer. This showed us the direction of longshore drift. We did this in locations close to the groyne and between the groynes. Our results were as followed:(graphs at top of page) group 1 was to the east of the beach, group 5 to the west of the beach, and the other groups between those two groups. There was no correlation in our results, as they all said different things. This could mean that the beach had mean managed recently, so long shore drift hadn't had time to properly move the sediment as much as it would have if the beach had not been managed. However, we did see that the further up the beach that you got, the higher the beach was. We saw that the beach was higher on the west than on the east, but in the middle there was no correlation. Group 1 was about 4 metres high, group 2 was about 6.5 metres high, group 3 was about 5.5 metres high, group 4 was 3 metres high, group 5 was about 9 metres high. This is clearly no correlation.
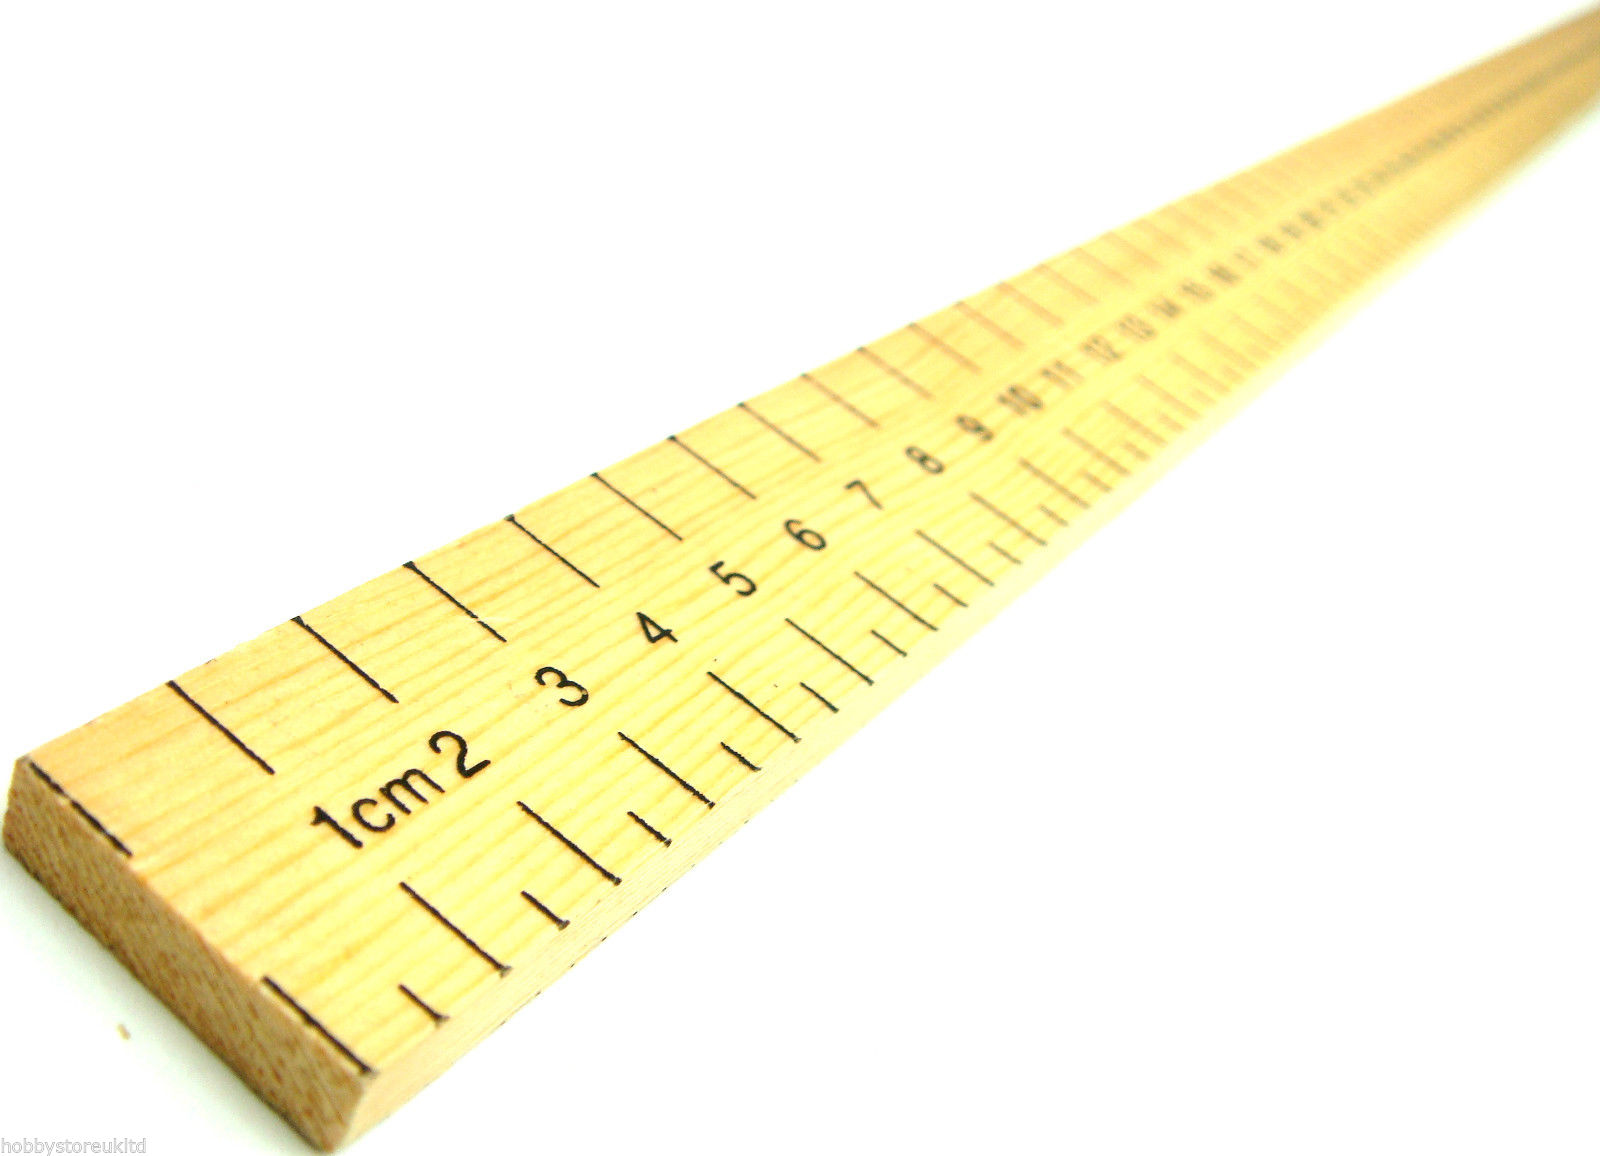
A metre ruler
|
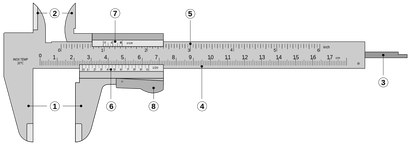
A caliper
|
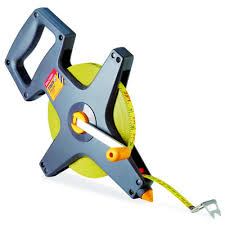
Tape measure
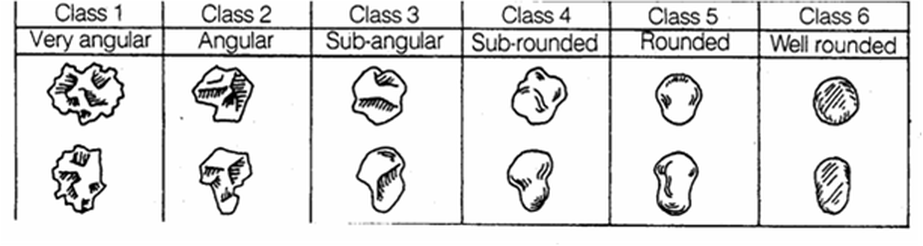
A chart to show the shape of pebbles
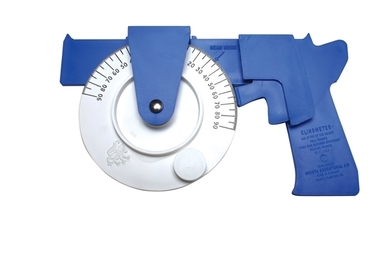
Gun clinometer
